Visualizations:
* Maps: These are essential for representing the distribution of geological features, topography, and other spatial data.
* Diagrams: These can be used to illustrate geological processes (like the rock cycle), structures (like fault lines), or the internal structure of the Earth.
* Graphs and charts: These are used to represent data trends, such as climate change over time or the distribution of different rock types.
* Models: These can be physical (like scaled-down versions of geological structures) or computer-generated (like simulations of plate tectonics).
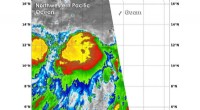
* Satellite imagery: This provides a broad view of the Earth's surface and can be used to study geological features, land use, and environmental changes.
Other Tools:
* Mathematical equations: These are used to describe and predict geological processes, like the movement of magma or the flow of groundwater.
* Computer programs: These are used to analyze data, create simulations, and perform complex calculations.
* Field observations: These provide direct evidence of geological processes and features.
The specific tool used will depend on the nature of the object or process being studied.