1. Chemical Equations:
* The most common and basic way. A chemical equation uses symbols and formulas to represent the reactants (starting materials) and products (resulting substances) of a reaction.
* Example:
* Reactants: 2 H₂ (g) + O₂ (g)
* Products: 2 H₂O (l)
* Full Equation: 2 H₂ (g) + O₂ (g) → 2 H₂O (l)
* Information conveyed:
* Identity of reactants and products
* Relative amounts of reactants and products (stoichiometry)
* State of matter (g = gas, l = liquid, s = solid, aq = aqueous)
* Limitations: Doesn't show the process or the energy changes involved.
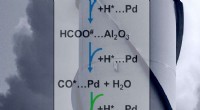
2. Reaction Mechanisms:
* Provides a step-by-step description of how a reaction occurs. Shows the sequence of individual steps (elementary reactions) that lead to the overall reaction.
* Example: The combustion of methane (CH₄) involves multiple steps, including:
* Initiation: CH₄ + O₂ → •CH₃ + •HO₂
* Propagation: •CH₃ + O₂ → CH₂O + •HO
•HO + CH₄ → •CH₃ + H₂O
* Termination: •CH₃ + •HO₂ → CH₃OOH
* Information conveyed: Explains the rate of a reaction and how it can be influenced by factors like temperature and catalyst.
* Limitations: Can be complex and challenging to understand for complex reactions.
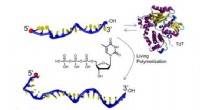
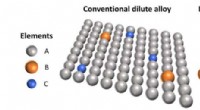
3. Molecular Models:
* Visual representations of molecules and their interactions.
* Example: Ball-and-stick models, space-filling models, or computer simulations can illustrate how molecules break and form bonds during a reaction.
* Information conveyed: Offers a 3D understanding of the shapes and spatial arrangements of molecules involved in the reaction.
* Limitations: May not accurately represent the dynamic nature of reactions and the constant motion of molecules.
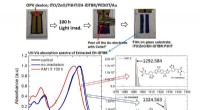
4. Energy Diagrams:
* Graphical representation of the energy changes that occur during a reaction.
* Information conveyed: Shows the activation energy required for the reaction to occur, the energy difference between reactants and products, and whether the reaction is exothermic (releases heat) or endothermic (absorbs heat).
* Limitations: Doesn't show the specific steps involved in the reaction.
5. Animations and Simulations:
* Interactive representations of chemical reactions.
* Information conveyed: Dynamically illustrate the movement of molecules, the formation and breaking of bonds, and the energy changes involved.
* Limitations: Requires specialized software and may not be as accurate as real-world experiments.
Ultimately, the method chosen to illustrate a chemical reaction depends on the specific information you want to convey and the level of understanding you want to achieve.