Key Points:
* Assumptions: The distribution is derived based on the following assumptions:
* The gas is ideal, meaning particles don't interact except for elastic collisions.
* The particles are in thermal equilibrium, meaning they have a constant average kinetic energy.
* The particles are moving randomly in all directions.
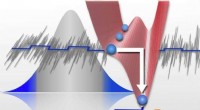
* The Distribution: The Maxwell distribution gives the probability that a randomly chosen particle from the gas will have a specific speed, *v*. The probability density function is given by:
```
f(v) = 4π (m / (2πkT))^3/2 * v^2 * exp(-mv^2 / 2kT)
```
Where:
* *f(v)* is the probability density of finding a particle with speed *v*
* *m* is the mass of a single particle
* *k* is the Boltzmann constant
* *T* is the absolute temperature
* Interpretation:
* The distribution is a bell-shaped curve with a peak at the most probable speed.
* The average speed is slightly higher than the most probable speed.
* The distribution is broader at higher temperatures, indicating that the particles have a wider range of speeds.
Significance:
* Understanding Gas Behavior: The Maxwell distribution explains many observed properties of gases, such as the pressure, viscosity, and thermal conductivity.
* Applications: The distribution has applications in many fields, including:
* Chemical kinetics: Predicting reaction rates
* Plasma physics: Describing the behavior of charged particles
* Astrophysics: Understanding the dynamics of stars and interstellar gas
Visual Representation:
The Maxwell distribution is often depicted as a graph with speed (v) on the x-axis and the probability density (f(v)) on the y-axis. The curve shows that:
* Most particles have speeds close to the most probable speed.
* Fewer particles have very low or very high speeds.
* The shape of the curve changes with temperature: higher temperatures lead to a wider distribution of speeds.
In summary:
The Maxwell distribution of velocities is a fundamental tool for understanding the behavior of gases. It provides a probabilistic description of the distribution of speeds of particles in a gas at thermal equilibrium, explaining the observed properties and contributing to advancements in various scientific disciplines.