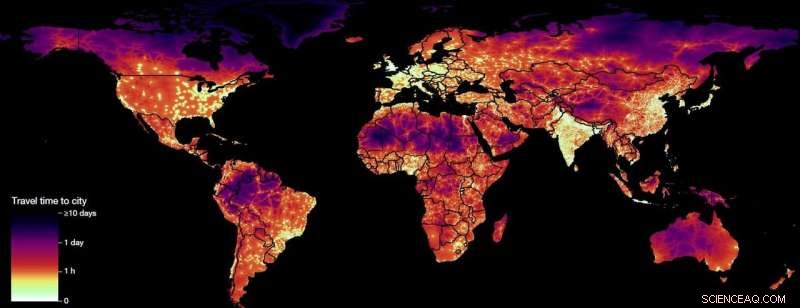
Global map of travel time to cities illustrating spatial disparities in accessibility to urban areas and the services they provide. The map ranges from minutes (bright yellow) to nearly a week (dark purple). Credit: The Malaria Atlas Project, University of Oxford
An international team of researchers, including a representative from Google, has created a color-coded map of the planet that shows travel times to cities from other places. In their paper published in the journal Nature, the group describes how they gathered their data and used it to plot their maps, and also discuss some things they found interesting in the maps they created.
Back in 2000, a group of researchers attempted to create the first map of the world that would reveal the distances people would have to travel to get to a city—but according to the team working on this new effort note, that was before the advent of modern infrastructure computer networks. Building such maps is important because it shows how well countries are doing in meeting the needs of their people. Cities offer services that simply cannot be matched in the wilderness, in a big jungle or in villages located on sparse desert landscapes.
To create their maps, the researchers, led by the Big Data Institute at the University of Oxford, used data from Open Street Maps and Google itself. They were able to capture representations of transportation networks across the globe, which they fed into engines that created maps with color coding that showed how far people in any given area would have to travel to reach a city of at least 50,000 people. It also produced statistics, showing, for example, that over 80 percent of the people alive in the world today live within one hour of a city.
As the researchers note, looking at the map offers proof of what most already know: that it takes a long time to drive or walk from desert outposts to distant cities in poor countries. But it also offers some surprises—for instance, in the United States, despite vast rural areas, there are very few people who live distant from a city. The maps also highlight what might be problems with initiatives such as the United Nations' Sustainable Development Goals. In looking at the new maps, it would be easy to assume, for example, that people living in the icy northern parts of Scandinavia are living in third world conditions, which clearly is not the case.
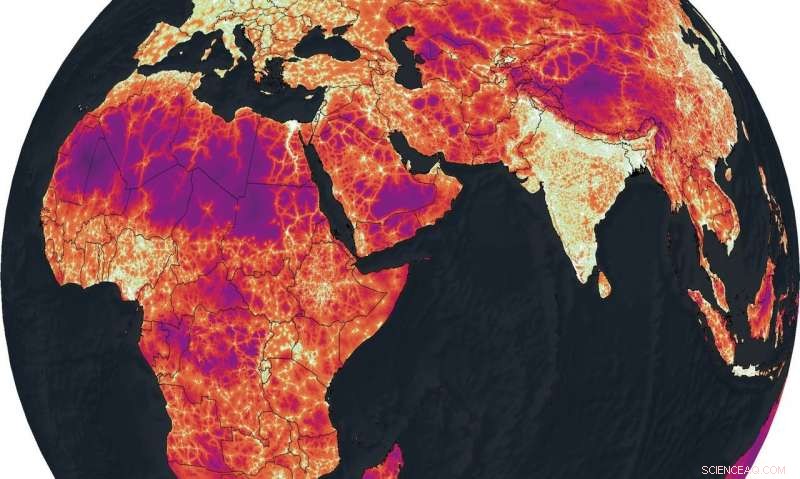
Credit: 2018 OpenStreetMap contributors, creative commons attribution 4.0
Still, it is clear that modern geographical networking tools are helping nations to better understand the challenges that they face, and perhaps aiding in creating initiatives to solve problems that such maps highlight.
© 2018 Phys.org