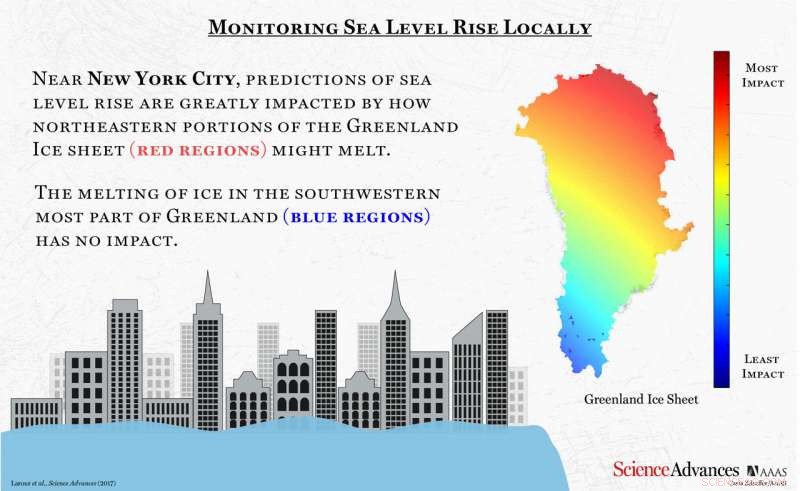
Gradient Fingerprint Mapping can be used to determine how loss of sea ice will impact sea level rise at a specific location. Credit: Carla Schaffer / AAAS
(Phys.org)—A trio of researchers at NASA's Jet Propulsion Laboratory has developed a new tool to map sea level rise for major cities depending on which parts of the Earth's ice sheets melt and by how much. In their paper published on the open access site Science Advances, Eric Larour, Erik Ivins and Surendra Adhikari describe the tool and the ways it can be used.
As the ice at the poles (and on mountain tops) slowly melts due to global warming, sea levels will rise—that much is obvious. Less obvious is how much rise in sea level different cities will actually experience—this is because the Earth spins (and wobbles) and because there are gravitational differences at different points on the planet—some due to the changes in mass of the ice itself. Because of this, it is difficult to say how much a given city will be impacted in the coming years. In this new effort, the team at NASA has made things much easier for city planners. They have created a tool that accounts for all the factors that will impact sea level changes at various points around the globe over time. The end result is that people responsible for long-term planning for cities that exist on or near the sea now have a tool that they can use to see how much sea levels are expected to rise for their city over a given time-frame.
As one example, the tool shows, the researchers report, that ice melting off the northwest corner of Greenland will have a direct impact on sea levels for London over the course of the next century. New York, on the other hand will be much more impacted by ice melting on the whole northern half of Greenland. Moving south, the tool shows that melting of the northern parts of the Antarctic ice sheet will have a profound impact on Sydney, Australia.
The researchers describe their tool as offering a sea-level fingerprint for the planet, one that can be modified as conditions change and more is learned about climate change.
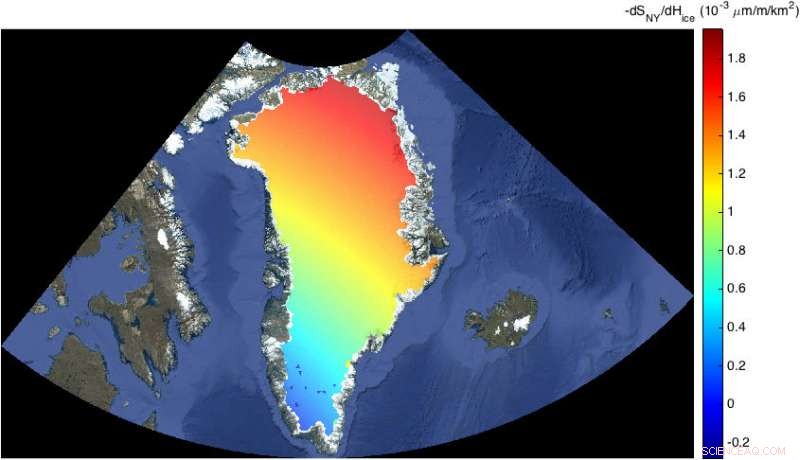
The gradient of sea level rise near New York City with respect to ice loss from the Greenland Ice Sheet. Red indicates a larger impact on NYC local sea level rise. Credit: NASA/JPL-Caltech
© 2017 Phys.org