* Area: How much space something takes up.
* Shape: The outline or form of something.
* Direction: Where something is relative to other things (north, south, east, west).
* Proximity: How close or far something is to something else.
* Distance: The amount of space between two points.
Here's how we represent these properties:
1. Maps: Maps are the most common way to represent Earth. They use various techniques:
* Scale: A ratio that relates distances on the map to distances on the ground. This lets us represent large areas in a manageable size.
* Projection: A method to transfer Earth's curved surface onto a flat map. Each projection has strengths and weaknesses in representing area, shape, and distance accurately.
* Symbols and Colors: Different symbols and colors can represent features like mountains, rivers, cities, and boundaries.
2. Geographic Information Systems (GIS): GIS is a powerful tool that allows us to:
* Store and analyze spatial data: GIS databases hold information about locations, shapes, and attributes (e.g., population, elevation).
* Visualize data: Create interactive maps with layers of information.
* Perform spatial analysis: Determine proximity, distance, and how different factors relate to each other geographically.
3. GPS (Global Positioning System): GPS uses satellites to pinpoint your exact location on Earth, providing:
* Precise coordinates: Latitude and longitude.
* Distance calculations: Measure the distance between your location and other points.
4. Remote Sensing: Technologies like satellite imagery and aerial photography capture data about the Earth's surface, providing:
* Detailed images: Show land cover, vegetation, and changes over time.
* Measurements: Analyze features like elevation, water bodies, and urban sprawl.
Examples of how these representations work together:
* A map of the world shows the shape of continents and oceans.
* A GIS map can display the proximity of schools to residential areas.
* GPS can be used to measure the distance traveled during a hike.
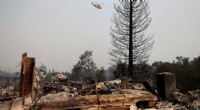
* Satellite imagery can show the area covered by a forest fire.
The best way to represent these geographic properties depends on the specific information you need and the purpose of the representation.