There are a number of different brain mapping techniques, each with its own advantages and disadvantages. Some of the most common techniques include:
* Magnetic resonance imaging (MRI): MRI uses strong magnets and radio waves to create images of the brain. MRI is a non-invasive technique, and it can produce very detailed images.
* Computed tomography (CT): CT scans use X-rays to create images of the brain. CT scans are faster than MRIs, but they do not produce as much detail.
* Positron emission tomography (PET): PET scans use radioactive tracers to measure the activity of different parts of the brain. PET scans can provide information about how the brain is working, but they are more invasive than MRI or CT scans.
* Electroencephalography (EEG): EEG measures the electrical activity of the brain. EEG can be used to study the brain's activity patterns, and it can also be used to diagnose seizures and other brain disorders.
* Magnetoencephalography (MEG): MEG measures the magnetic fields produced by the brain. MEG can be used to study the brain's activity patterns, and it can also be used to diagnose brain disorders.
Once a brain map has been created, it can be used for a variety of purposes. For example, brain maps can be used to:
* Study the structure of the brain.
* Diagnose brain diseases.
* Understand how the brain works.
* Develop new treatments for brain disorders.
Brain mapping is a powerful tool that has helped us to learn a great deal about the brain. As our understanding of the brain continues to grow, brain mapping will continue to play an important role.
How to Read a Brain Map
Brain maps can be difficult to read at first, but with a little practice, it is possible to learn what the different colors and shapes mean.
The first thing to understand is that brain maps are not pictures of the brain itself. Instead, they are representations of the brain's activity. The colors and shapes on a brain map correspond to different levels of activity in different parts of the brain.
The most common type of brain map is a functional MRI (fMRI) map. fMRI maps show how the brain responds to different stimuli. When you look at an fMRI map, you will see that some parts of the brain light up when you are doing certain things, such as talking, reading, or moving.
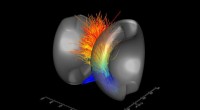
The colors on an fMRI map represent different levels of activity. Red and orange areas are the most active, while blue and green areas are less active.
The shapes on an fMRI map represent different regions of the brain. The frontal lobe is at the front of the brain, the parietal lobe is at the top, the temporal lobe is at the side, and the occipital lobe is at the back.
By looking at the colors and shapes on an fMRI map, you can learn about how your brain responds to different stimuli. This information can be used to study brain diseases, develop new treatments, and understand how the brain works.
Here are some more tips for reading brain maps:
* Look at the legend to understand what the colors and shapes mean.
* Find the areas of the brain that are most active when you are doing a certain task.
* Compare brain maps from different people to see how their brains respond to different stimuli.
* Talk to a neurologist or other brain specialist to learn more about brain maps.
Brain mapping is a powerful tool that can help us to learn more about the brain and how it works. By understanding brain maps, we can better understand ourselves and the world around us.