By Chris Deziel | Updated Mar 24, 2022
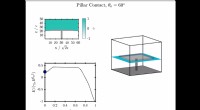
During a typical acid–base titration, the evolving pH is plotted against the volume of titrant added. The resulting curve starts with a gradual rise, then steepens sharply at the equivalence point where all acid has been neutralised. The point exactly halfway between the origin and the equivalence point on the x‑axis is the half‑equivalence point. At this juncture the solution’s pH equals the acid’s dissociation constant, pKa.
The titration is monitored using a colour‑changing indicator, a pH meter, a potentiometer, or spectroscopic techniques. As the base is added, the pH climbs slowly until it reaches the equivalence point; beyond that the curve rises steeply. After the equivalence volume, the slope tapers again and the pH increases more gradually.
Identify the equivalence point by locating the inflection where the curve transitions from the gentle to the steep slope. Once that volume is known, the half‑equivalence point is simply the midpoint on the x‑axis between zero volume and the equivalence volume.
The Henderson‑Hasselbalch equation, pH = pKa + log([A⁻]/[HA]), links the acid–base ratio to the pH. At the half‑equivalence point the concentrations of the acid (HA) and its conjugate base (A⁻) are equal, making the ratio one. Consequently, log 1 = 0 and the equation reduces to pH = pKa. Therefore, by drawing a vertical line to the half‑equivalence volume and a horizontal line to the y‑axis, the pKa can be read directly from the curve.
Knowing the half‑equivalence point is crucial for characterising weak acids, designing buffer systems, and validating titration protocols.