By Andy Pasquesi | Updated Mar 24, 2022
CMB/Moment/GettyImages
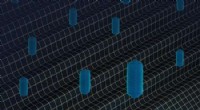
Gel electrophoresis is a cornerstone technique in molecular biology that separates DNA fragments by size and reveals them for analysis. By embedding DNA samples in an agarose gel matrix and applying an electric field, the negatively charged strands migrate toward the anode, with shorter fragments traveling faster than longer ones.
Ethidium bromide (EtBr) is incorporated into the agarose mixture (agarose powder, EDTA buffer, water). Once the gel polymerizes, EtBr is evenly distributed throughout the matrix. After loading DNA samples and tracking dyes into the wells, the gel is subjected to a controlled voltage that draws the DNA through the pores.
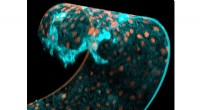
As the strands move, EtBr intercalates between base pairs, temporarily binding to the DNA and carrying the fluorescence signal along. At the end of the run, each fragment has absorbed a substantial amount of EtBr. Illuminating the gel with a UV transilluminator excites the bound dye, causing the DNA bands to glow. A calibrated camera captures the image for documentation.
When a UV transilluminator is unavailable, the gel can be stained with methylene blue. After electrophoresis, soaking the gel overnight in a methylene blue solution allows the dye to penetrate the matrix and bind to the DNA via hydrogen bonding. The resulting blue coloration is visible to the naked eye, providing a simple, low‑cost alternative to fluorescence.
Tracking dyes—such as bromophenol blue and xylene cyanol—are added to the loading buffer to monitor progress without interfering with DNA migration. Bromophenol blue moves at a rate equivalent to ~300 nucleotides, while xylene cyanol matches ~4,000 nucleotides. By comparing a DNA band’s position to these markers, technicians can estimate fragment size in base pairs.
In summary, gel electrophoresis coupled with appropriate staining and tracking dyes enables precise visualization and sizing of DNA fragments, forming the basis of countless genetic analyses.