By Andy Nambil, Updated Aug 30, 2022
Some traits are inherited through genetics. DNA, housed on chromosomes, is transmitted from parents to offspring—half from each parent. Genes, specific DNA segments, encode traits, and alleles represent distinct versions of a gene.
Mendelian traits, first described by Gregor Mendel, are governed by single genes. A person who carries two identical alleles is homozygous; if the alleles differ, the individual is heterozygous. These genetic combinations (genotype) determine the observable characteristics (phenotype). A dominant allele is expressed whenever it is present, whether in a homozygous or heterozygous state. A recessive allele only manifests when an individual is homozygous for that allele.
Punnett squares graphically represent the possible genotypes and phenotypes that result from a cross between parents of known genotype. The first generation of offspring is labeled F1, the next F2, and so on. In a classic cross between a homozygous dominant parent and a homozygous recessive parent, all F1 offspring will be heterozygous and display the dominant phenotype. When two heterozygous F1 individuals mate, the expected F2 genotypic ratio is 1:2:1 (25% homozygous dominant, 50% heterozygous, 25% homozygous recessive). Because the homozygous dominant and heterozygous genotypes produce the same phenotype, the phenotypic ratio in F2 is 3:1 (75% dominant, 25% recessive).
When studying family histories, a pedigree that maps phenotypes across two to three generations can help infer unknown genotypes. Choose classic Mendelian traits—such as attached earlobes, freckles, right‑thumb-up when fingers are interlaced, or a widow’s peak—and construct a pedigree for each. Record the observed proportions and compare them to the expected Punnett square outcomes to determine whether each trait follows a dominant or recessive inheritance pattern. If the pedigree lacks sufficient data to resolve the inheritance mode, note the limitation and explain why.
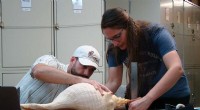
Cross a barred Plymouth Rock rooster with a white Araucana rumpless hen. Observe whether the dominant traits—blue‑green egg production, barred feathering, and tail development—appear in the adult offspring.
For a rapid, clean genetics experiment, use the WKU Biology website’s virtual fly laboratory. Mate various Drosophila melanogaster strains and analyze the approximate 500 F1 progeny that appear on screen. With a single click, view the F2 generation, calculate the phenotypic proportions and ratios, and infer the underlying genotypic distribution.