Clarity and Simplicity:
* Clear Labels: All structures should be clearly labeled with appropriate scientific terms. Avoid using abbreviations unless they are universally understood.
* Concise Information: Include only the essential details relevant to the specific topic. Avoid cluttering the diagram with unnecessary information.
* Well-Organized Layout: Structures should be arranged logically and with clear spacing to avoid confusion.
* Consistent Style: Use a consistent font, size, and style for labels and annotations.
Accuracy and Detail:
* Anatomically Correct: The diagram should accurately represent the structure and relationship of biological components.
* Appropriate Level of Detail: The level of detail should be appropriate for the target audience and purpose.
* Consistent Scale: Maintain a consistent scale throughout the diagram. If multiple structures are represented, use a scale bar for reference.
Visual Impact:
* Visually Appealing: Use clear and distinct colors, line weights, and shading to highlight different structures and relationships.
* 3D Representation (where appropriate): Consider using 3D representations for complex structures like organs or tissues.
* Artistic Representation: Use artistic skills to make the diagram aesthetically pleasing without compromising accuracy.
Other Considerations:
* Purpose: Consider the intended audience and purpose of the diagram. Is it for a textbook, scientific publication, or classroom presentation?
* Context: Provide context for the diagram by including a title, legend, or brief explanation.
* Sources: Always cite the sources of information used to create the diagram.
Examples:
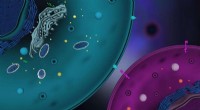
* Cell Diagram: Clear labels for organelles, accurate representation of their relative sizes, and visually distinct colors for each structure.
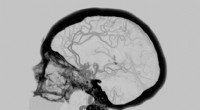
* Nervous System Diagram: Detailed representation of the brain, spinal cord, and peripheral nerves, with clear connections between components.
* DNA Structure Diagram: Accurate representation of the double helix, clearly labeled nucleotides and bonds, and use of color to differentiate strands.
Remember: A good biological diagram is more than just a picture; it's a tool for understanding and communicating complex scientific information. By following these guidelines, you can create effective and visually engaging diagrams that will enhance your learning and teaching experiences.