1. Phylogenetic Trees (Cladograms & Dendrograms)
* Concept: These diagrams depict the evolutionary relationships between different species or groups. They are like family trees, showing how lineages split and diverge over time.
* Types:
* Cladograms: Focus on branching patterns and shared derived characteristics (synapomorphies), showing evolutionary relationships.
* Dendrograms: Include branch lengths that represent evolutionary time or genetic distance, providing additional information about the rate of evolution.
* Advantages: Visually clear, good for illustrating common ancestry, can show relative evolutionary distances.
* Limitations: Doesn't always reflect actual time scale accurately, can be complex for large datasets.
2. Evolutionary Timeline
* Concept: A linear representation of key events in a species' evolutionary history, arranged chronologically.
* Advantages: Easy to understand the sequence of major changes, good for showing the timeframe of evolution.
* Limitations: Limited in showing branching patterns and complex relationships.
3. Fossil Record
* Concept: Fossil remains, trace fossils, and geological context provide direct evidence of ancient life forms.
* Advantages: Provides concrete evidence of extinct species, can show anatomical changes over time, helps reconstruct past environments.
* Limitations: Incomplete record, fossilization is a rare event, can be difficult to date accurately.
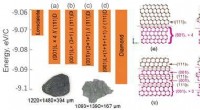
4. Molecular Data (DNA & Protein Sequences)
* Concept: Comparing genetic sequences of different organisms allows for reconstruction of evolutionary relationships based on shared genetic similarities.
* Advantages: Provides a precise measure of genetic distance, can be used to analyze relationships between very distantly related organisms.
* Limitations: Requires advanced technology and analysis, can be influenced by factors like mutation rates and gene transfer.
5. Biogeographic Maps
* Concept: Maps showing the distribution of a species or its ancestors over time, highlighting the impact of geographical isolation and migration on evolution.
* Advantages: Illustrates how geographical factors influenced speciation and dispersal.
* Limitations: Requires detailed knowledge of past geographical conditions and species distributions.
Example:
Consider the evolutionary history of the horse. It can be displayed using:
* Phylogenetic tree: Showing the branching pattern from early ancestors to modern horses, highlighting key adaptations like size and tooth morphology.
* Timeline: Depicting the appearance of different horse species and their geological periods.
* Fossil record: Exhibits a gradual transition from small, multi-toed ancestors to larger, single-toed horses with specialized teeth.
These methods are often used in combination to create a comprehensive understanding of a species' evolutionary journey.