1. Data Collection:
* Direct Observation: Scientists directly observe phenomena, often using instruments like microscopes, telescopes, or specialized sensors. They record observations in field notes, lab notebooks, or digital databases.
* Surveys and Questionnaires: Used to gather information from people about their opinions, beliefs, behaviors, or experiences.
* Experiments: Controlled studies where variables are manipulated to test hypotheses. Data is meticulously recorded in lab notebooks or electronic data loggers.
* Data Mining: Extracting meaningful patterns and insights from large datasets, often collected from databases or online sources.
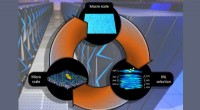
* Simulation and Modeling: Using computer programs to simulate real-world phenomena and generate data.
2. Data Recording:
* Lab Notebooks: Traditional and essential for meticulous record-keeping, including observations, measurements, experimental protocols, and calculations.
* Electronic Spreadsheets: Organize and analyze numerical data efficiently.
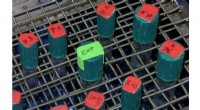
* Databases: Store large datasets for easy retrieval and analysis.
* Digital Imaging: Capture images and videos for analysis and documentation.
* Audio Recording: Used to capture interviews, field recordings, and other sound data.
3. Data Interpretation:
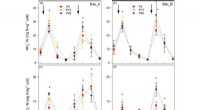
* Statistical Analysis: Identifying trends, relationships, and patterns in data using statistical methods. This involves calculating measures like averages, standard deviations, correlations, and statistical significance.
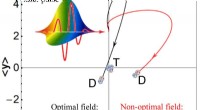
* Visualization: Creating graphs, charts, and maps to visually represent data and make patterns easier to understand.
* Qualitative Analysis: Examining non-numerical data like text, images, or audio recordings to identify themes, meanings, and insights.
* Comparison to Existing Knowledge: Scientists compare their findings to existing scientific literature and theories to draw conclusions and generate new hypotheses.
* Peer Review: Scientists submit their research findings to peer review, where other experts evaluate the methods, analysis, and conclusions.
Key Principles of Data Recording and Interpretation:
* Accuracy: Data must be recorded accurately and precisely.
* Objectivity: Scientists strive to be unbiased and avoid letting personal beliefs influence their observations and interpretations.
* Repeatability: Experiments and observations should be repeatable to ensure the results are reliable.
* Transparency: Methods and data should be transparent and readily available for others to verify and build upon.
Example:
A biologist studying the impact of climate change on coral reefs might:
1. Collect data: Use underwater cameras to document coral bleaching events, take water samples to analyze temperature and salinity, and record observations of fish populations.
2. Record data: Enter observations and measurements into a database and log information in a field notebook.
3. Analyze data: Use statistical software to analyze the relationship between water temperature and coral bleaching severity, compare fish populations over time, and create maps showing the spatial distribution of coral bleaching.
4. Interpret data: Draw conclusions about the impact of rising temperatures on coral reefs and their ecosystems, and publish their findings in a scientific journal.
Ultimately, the goal of data recording and interpretation is to advance scientific understanding by uncovering new knowledge, testing hypotheses, and developing theories.