1. Organize and Summarize Data:
* Data Tables: They organize their data into clear tables or spreadsheets, making it easier to see patterns and trends.
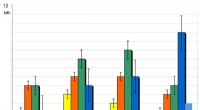
* Graphs: They create graphs (bar charts, line graphs, scatter plots, etc.) to visually represent the data and make it easier to understand relationships between variables.
* Descriptive Statistics: They use calculations like mean, median, mode, standard deviation, etc. to describe the central tendency and variability of the data.
2. Interpret Results:
* Identify Trends and Patterns: They look for any significant relationships, correlations, or differences between the experimental groups.
* Draw Conclusions: They use the data to answer their original research question and draw conclusions about the phenomenon they were investigating.
* Consider Sources of Error: They critically evaluate their methods and identify potential sources of error that might have affected the results.
3. Communicate Findings:
* Write Reports: They create written reports summarizing their methods, results, and conclusions.
* Present at Conferences: They share their findings with other scientists by presenting their research at conferences.
* Publish in Journals: They submit their research for publication in scientific journals, allowing their findings to be peer-reviewed and disseminated to a wider audience.
4. Evaluate and Refine:
* Compare to Existing Knowledge: They compare their results with previous research in the field to see if their findings support or challenge current understanding.
* Generate New Questions: Their analysis might lead them to new questions or hypotheses for further research.
* Repeat Experiments: They might decide to repeat the experiment with modifications to further validate their findings or explore specific aspects in more detail.
In essence, analyzing experimental results is a process of making sense of the data, drawing conclusions, and contributing to scientific knowledge.