* Tables: Tables are a structured way to organize data in rows and columns, allowing for easy comparison and analysis.
* Graphs: Graphs are visual representations of data, which can be used to show trends, relationships, and patterns. Common types of graphs include line graphs, bar graphs, pie charts, and scatter plots.
* Histograms: These are bar graphs that show the distribution of data, with the height of each bar representing the frequency of data within a specific range.
* Box plots: These graphs display the distribution of data using quartiles, showing the median, range, and potential outliers.
* Scatter plots: Scatter plots show the relationship between two variables, allowing scientists to observe correlations or trends.
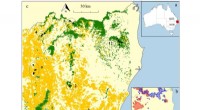
* Maps: Maps are useful for visualizing data that has a spatial component, such as the distribution of a species or the location of an event.
The specific method used depends on the type of data being analyzed and the research question being investigated.