By Nicole LeBoeuf‑Little, updated March 24, 2022
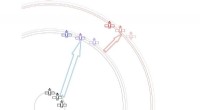
Our Sun serves as the benchmark for all stellar measurements. Its mass, luminosity, and surface temperature locate the origin of the Hertzsprung‑Russell diagram, a tool that reliably predicts a star’s mass, age, and evolutionary state.
The horizontal axis shows a star’s surface temperature in Kelvin, increasing from right to left. Each tick represents a temperature twice the next warmer star. Spectral classes (O, B, A, F, G, K, M) correlate with temperature and color, from blue‑white hot stars to red‑cool ones.
The vertical axis measures luminosity, typically expressed relative to the Sun (L☉). Labels advance by powers of ten: 10⁻⁴, 10⁻³, …, 10⁴, etc. Alternatively, absolute magnitude—visible brightness at 10 parsecs—can be plotted.
Stars that fuse hydrogen in their cores occupy the main‑sequence band, a diagonal curve running from the hot, luminous upper‑left to the cool, dim lower‑right. Brightness and temperature rise together; mass drives both properties, so stars nearer the upper‑left are heavier than the Sun, while those toward the lower‑right are lighter.
Stars plotted in the upper‑right quadrant are bright but cool—red giants. Their cores have ignited helium (and sometimes heavier elements), and their outer envelopes have expanded to the point of cooling into the red spectrum. Their luminosity stems from their vast radii rather than temperature.
In the lower‑left corner lie hot yet faint white dwarfs. After a Sun‑mass star expels its outer layers, gravity compresses the remaining carbon‑oxygen core to extreme densities, producing high core temperatures that equal the surface temperature. Because the radius is minuscule, the overall luminosity is low, placing them to the left. As they radiate away heat, they drift downwards and rightward until they fade.