Here's how it works:
1. Ozone-measuring instruments: Satellites like Aura and OMI carry instruments called spectrometers. These instruments measure the amount of ultraviolet (UV) radiation that is absorbed by ozone in the atmosphere.
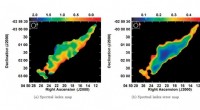
2. Data analysis: The data gathered by the spectrometers is analyzed to create maps showing the concentration of ozone in different parts of the atmosphere.
3. Visual representation: These maps are then used to visualize the ozone hole, which appears as a region of significantly reduced ozone concentration.
These maps provide crucial information about the ozone hole:
* Location: The location of the ozone hole over Antarctica.
* Size: The area covered by the ozone hole.
* Severity: The depth of the ozone depletion, indicating the severity of the problem.
* Temporal changes: How the ozone hole has changed over time, indicating its growth or shrinking.
Therefore, NASA satellite data does not display photographs of the ozone hole, but rather scientific measurements and maps that provide a quantitative understanding of its size, severity, and evolution.
It is important to note that the ozone hole is a complex phenomenon that is influenced by various factors, including human activities. The data gathered by NASA satellites has played a crucial role in understanding these factors and developing policies to protect the ozone layer.